
Test
Overview and Purpose
Overview of the MACAN Curriculum for Teachers
Next Generation Science Standards (NGSS)
How to Use This Curriculum
Curriculum Overview
Explore the Curriculum
This section introduces the curriculum and key concepts in ocean acidification through background reading and short videos. It includes NGSS-aligned questions and transcripts that can be used in class or for flipped learning.
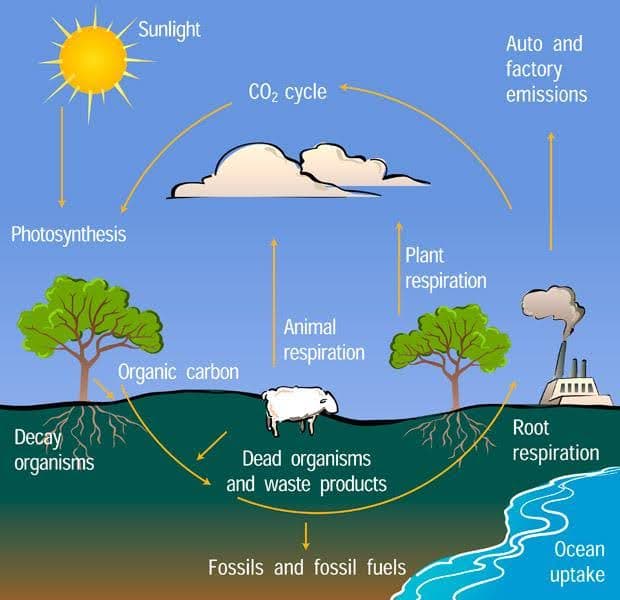
Students learn how carbon moves through Earth’s systems and how emissions affect atmospheric CO₂. An interactive game helps reinforce sources and sinks through hands-on participation.
Section 3 - Introduction to Ocean Acidification: How does CO2 cause change in the pH of water?
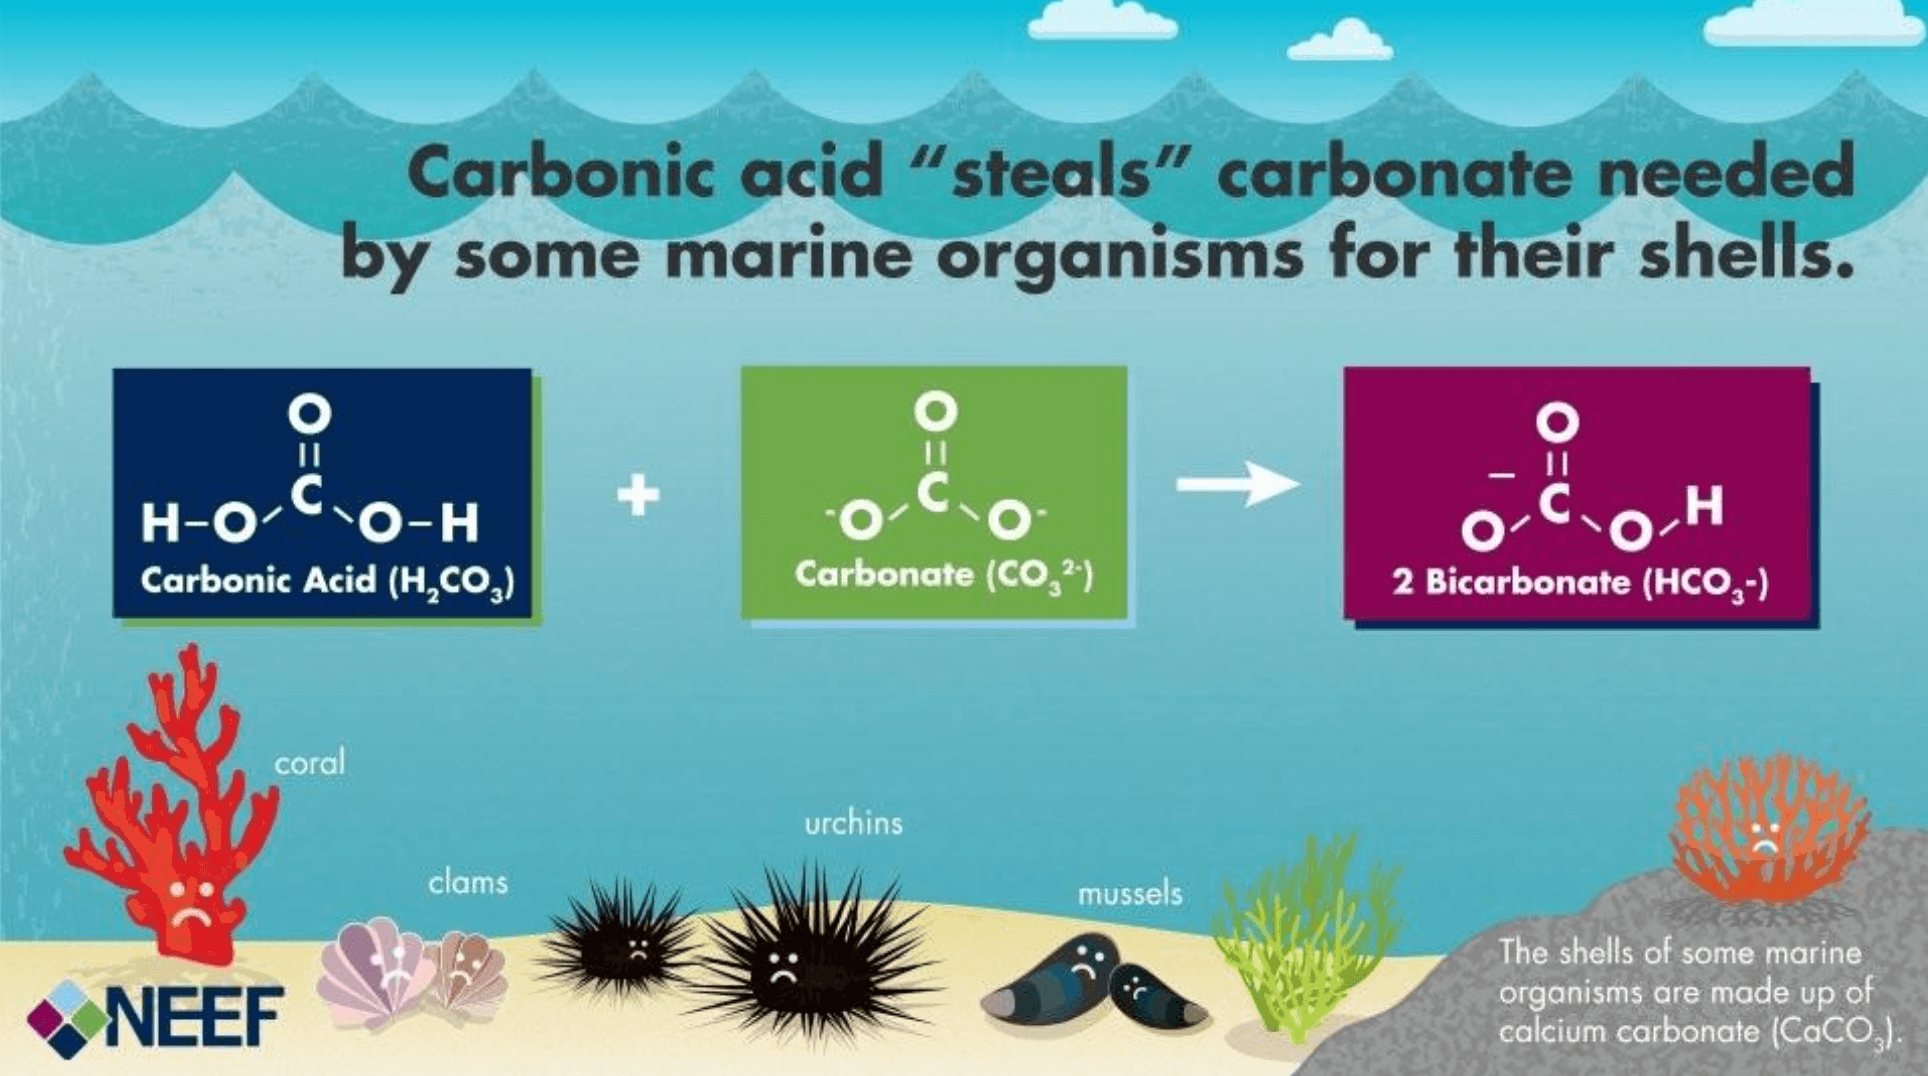
Students explore how increased atmospheric CO₂ changes ocean pH and water chemistry. Demonstrations and guided activities help introduce the foundational processes behind ocean acidification.
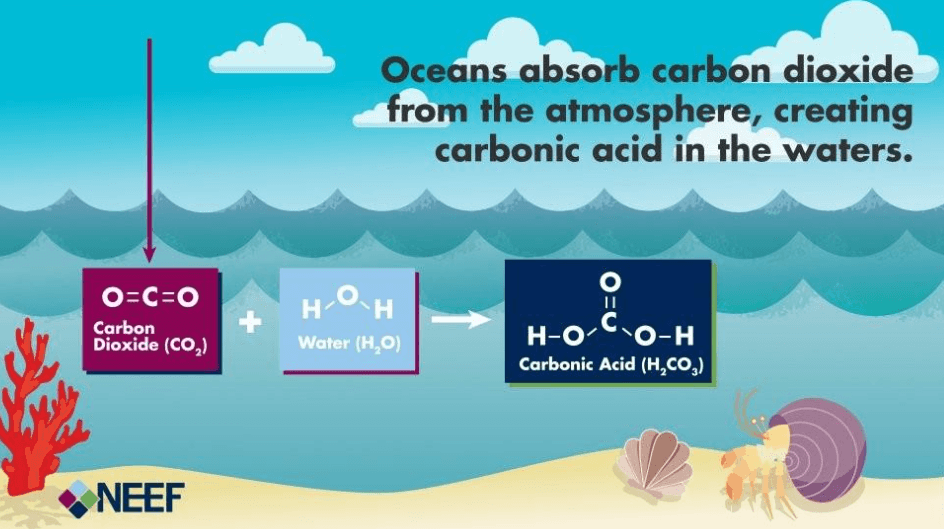
Through hands-on lab activities, students investigate the chemical reactions that drive ocean acidification. These labs also introduce how changes in chemistry affect shell formation in marine organisms.
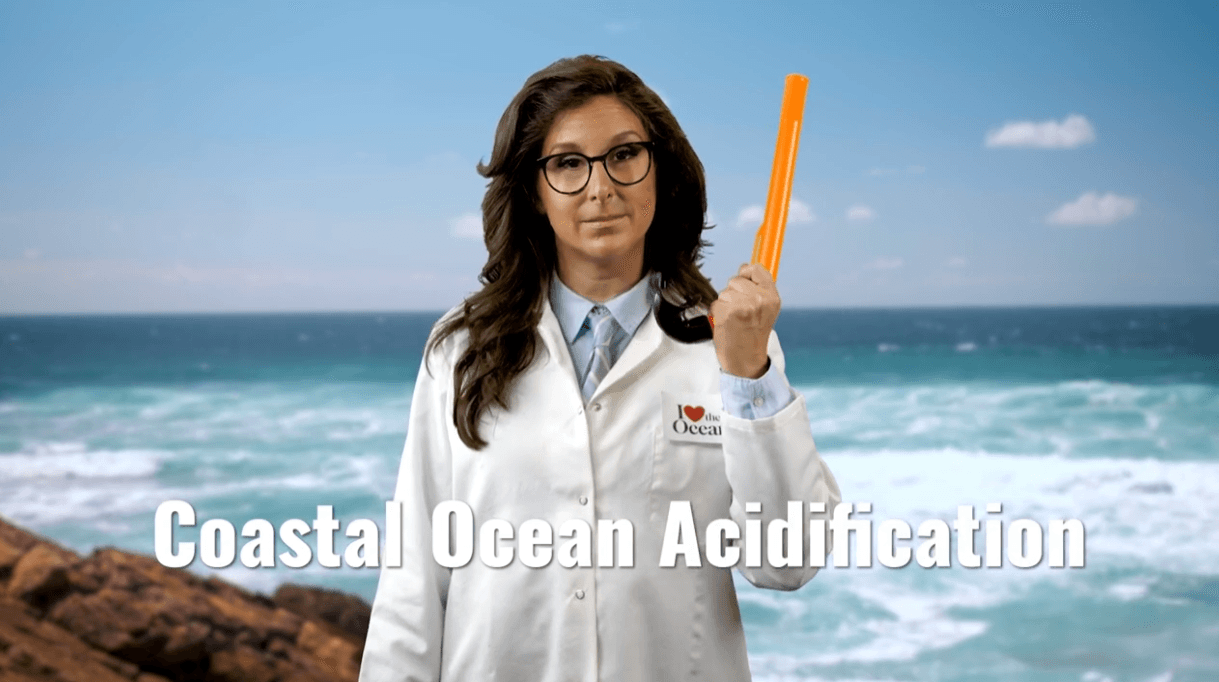
Section 5 - Coastal Acidification
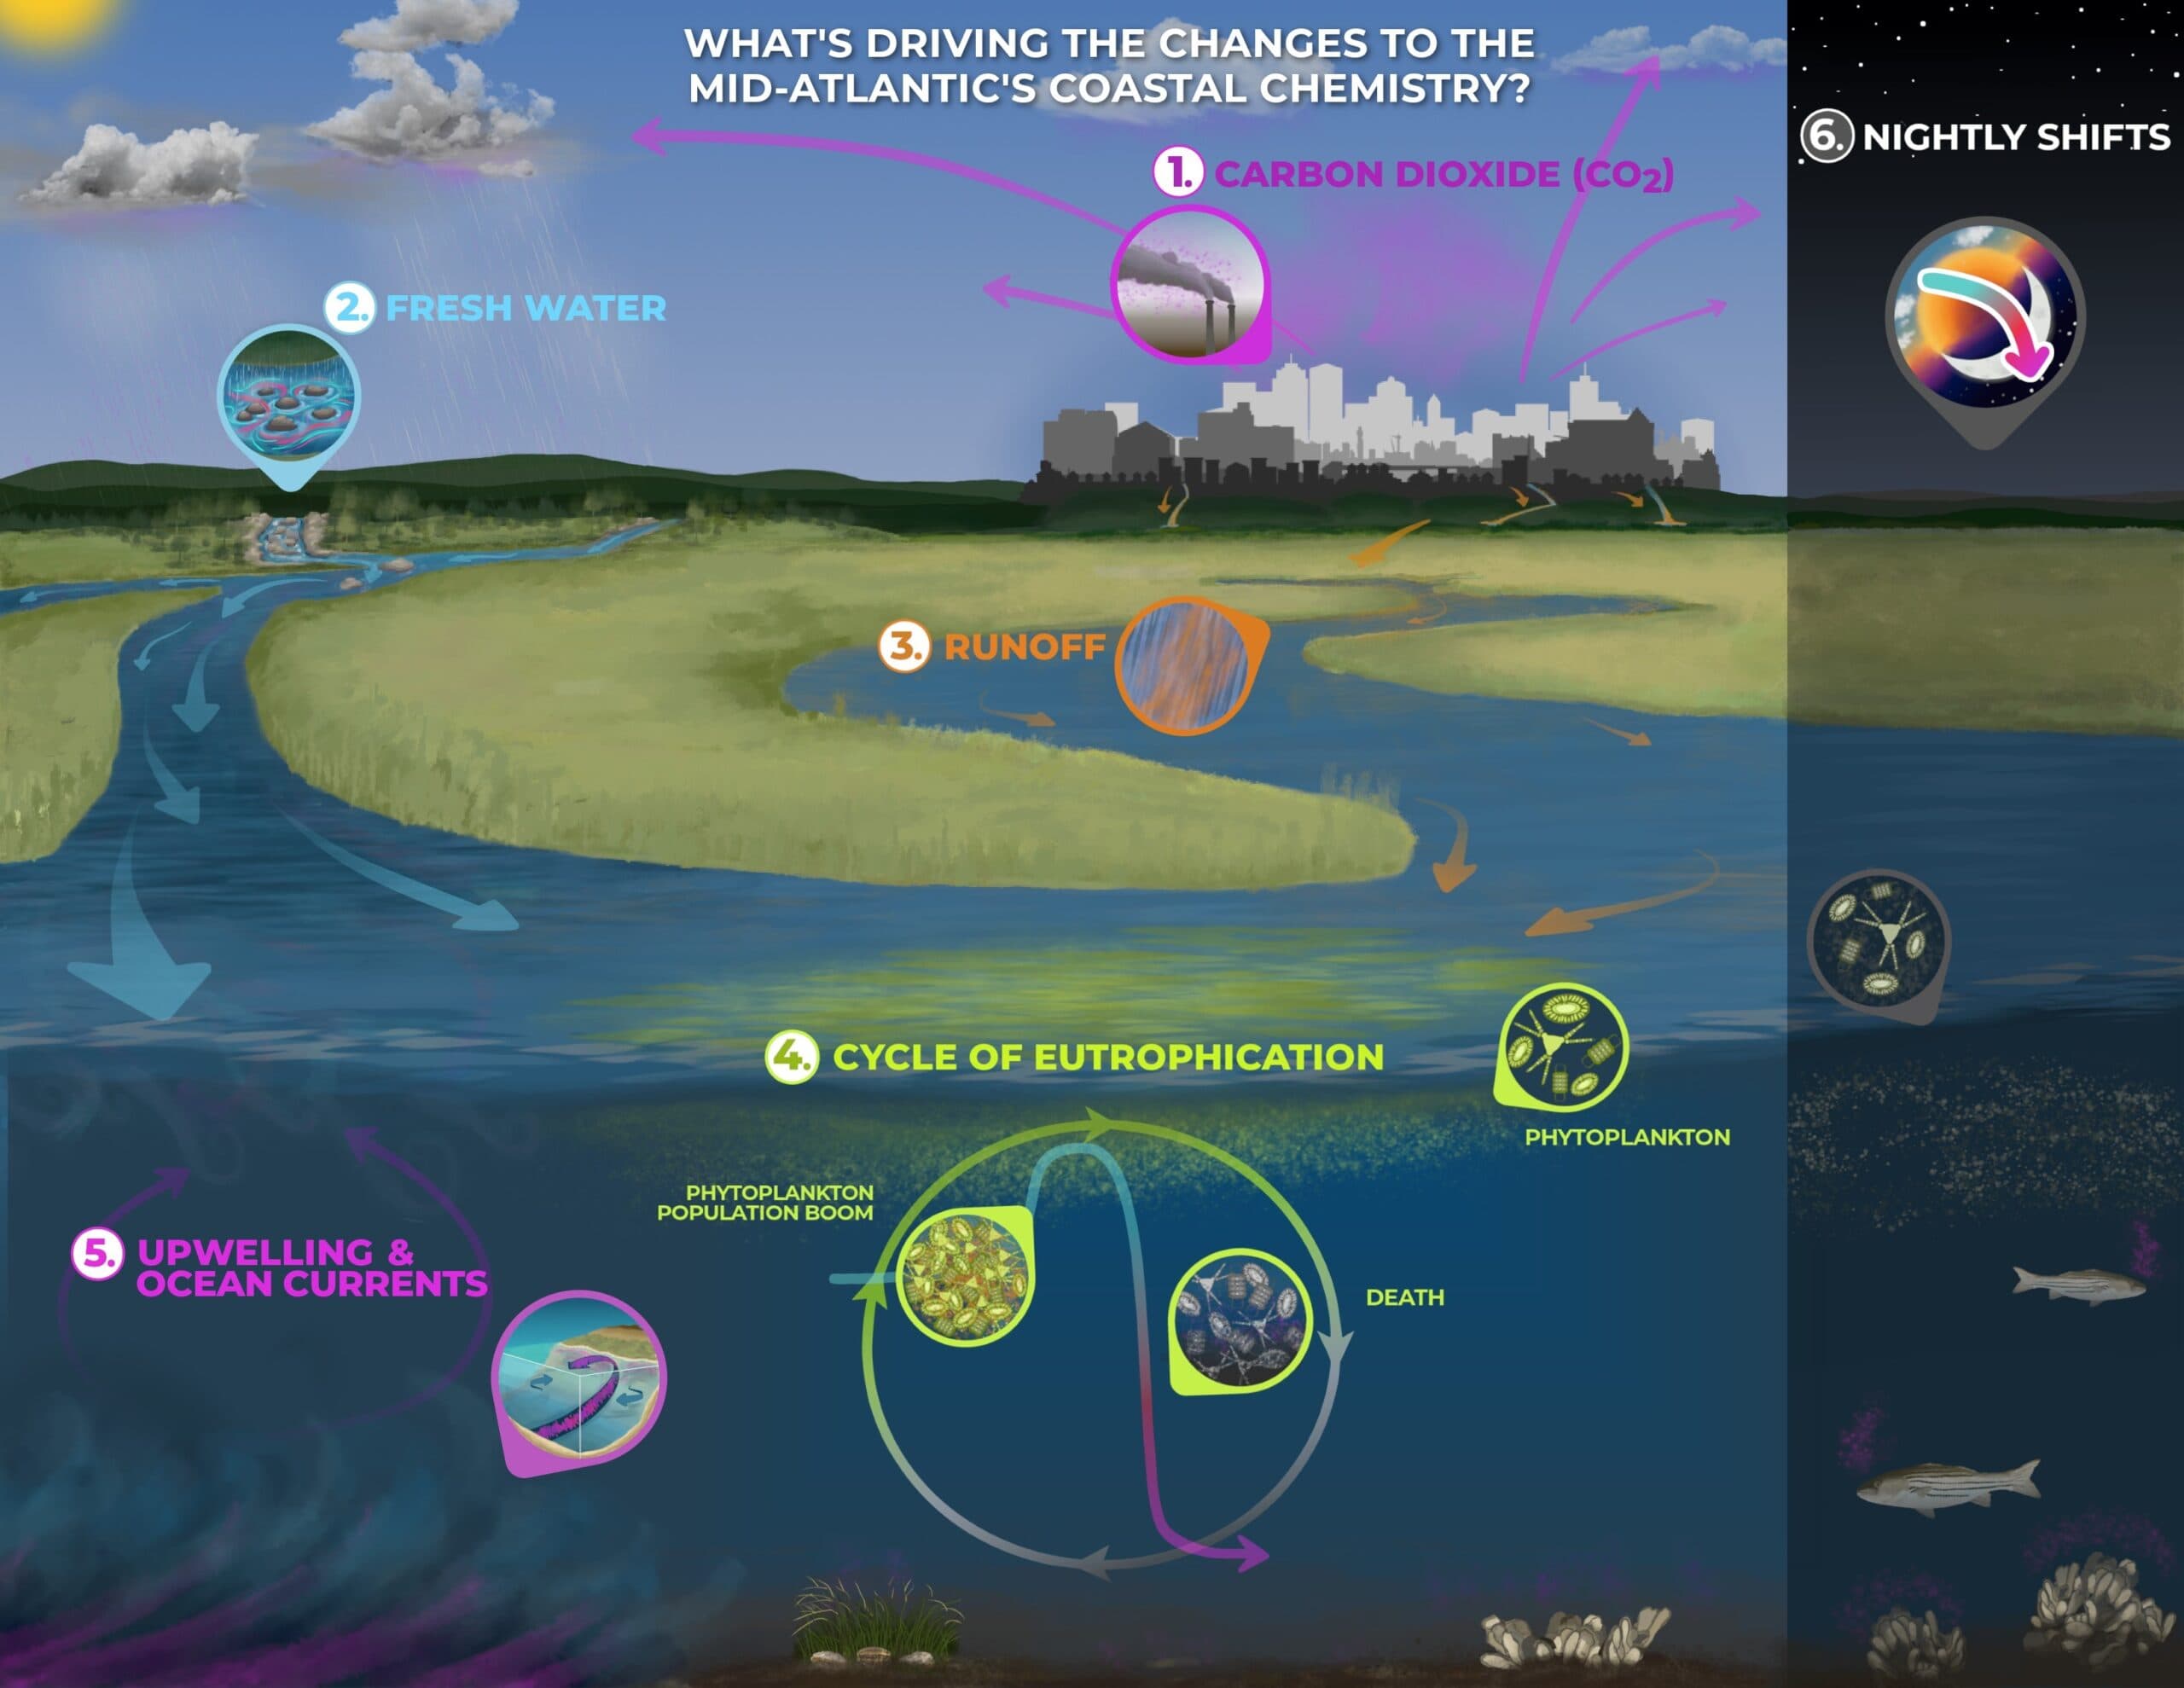
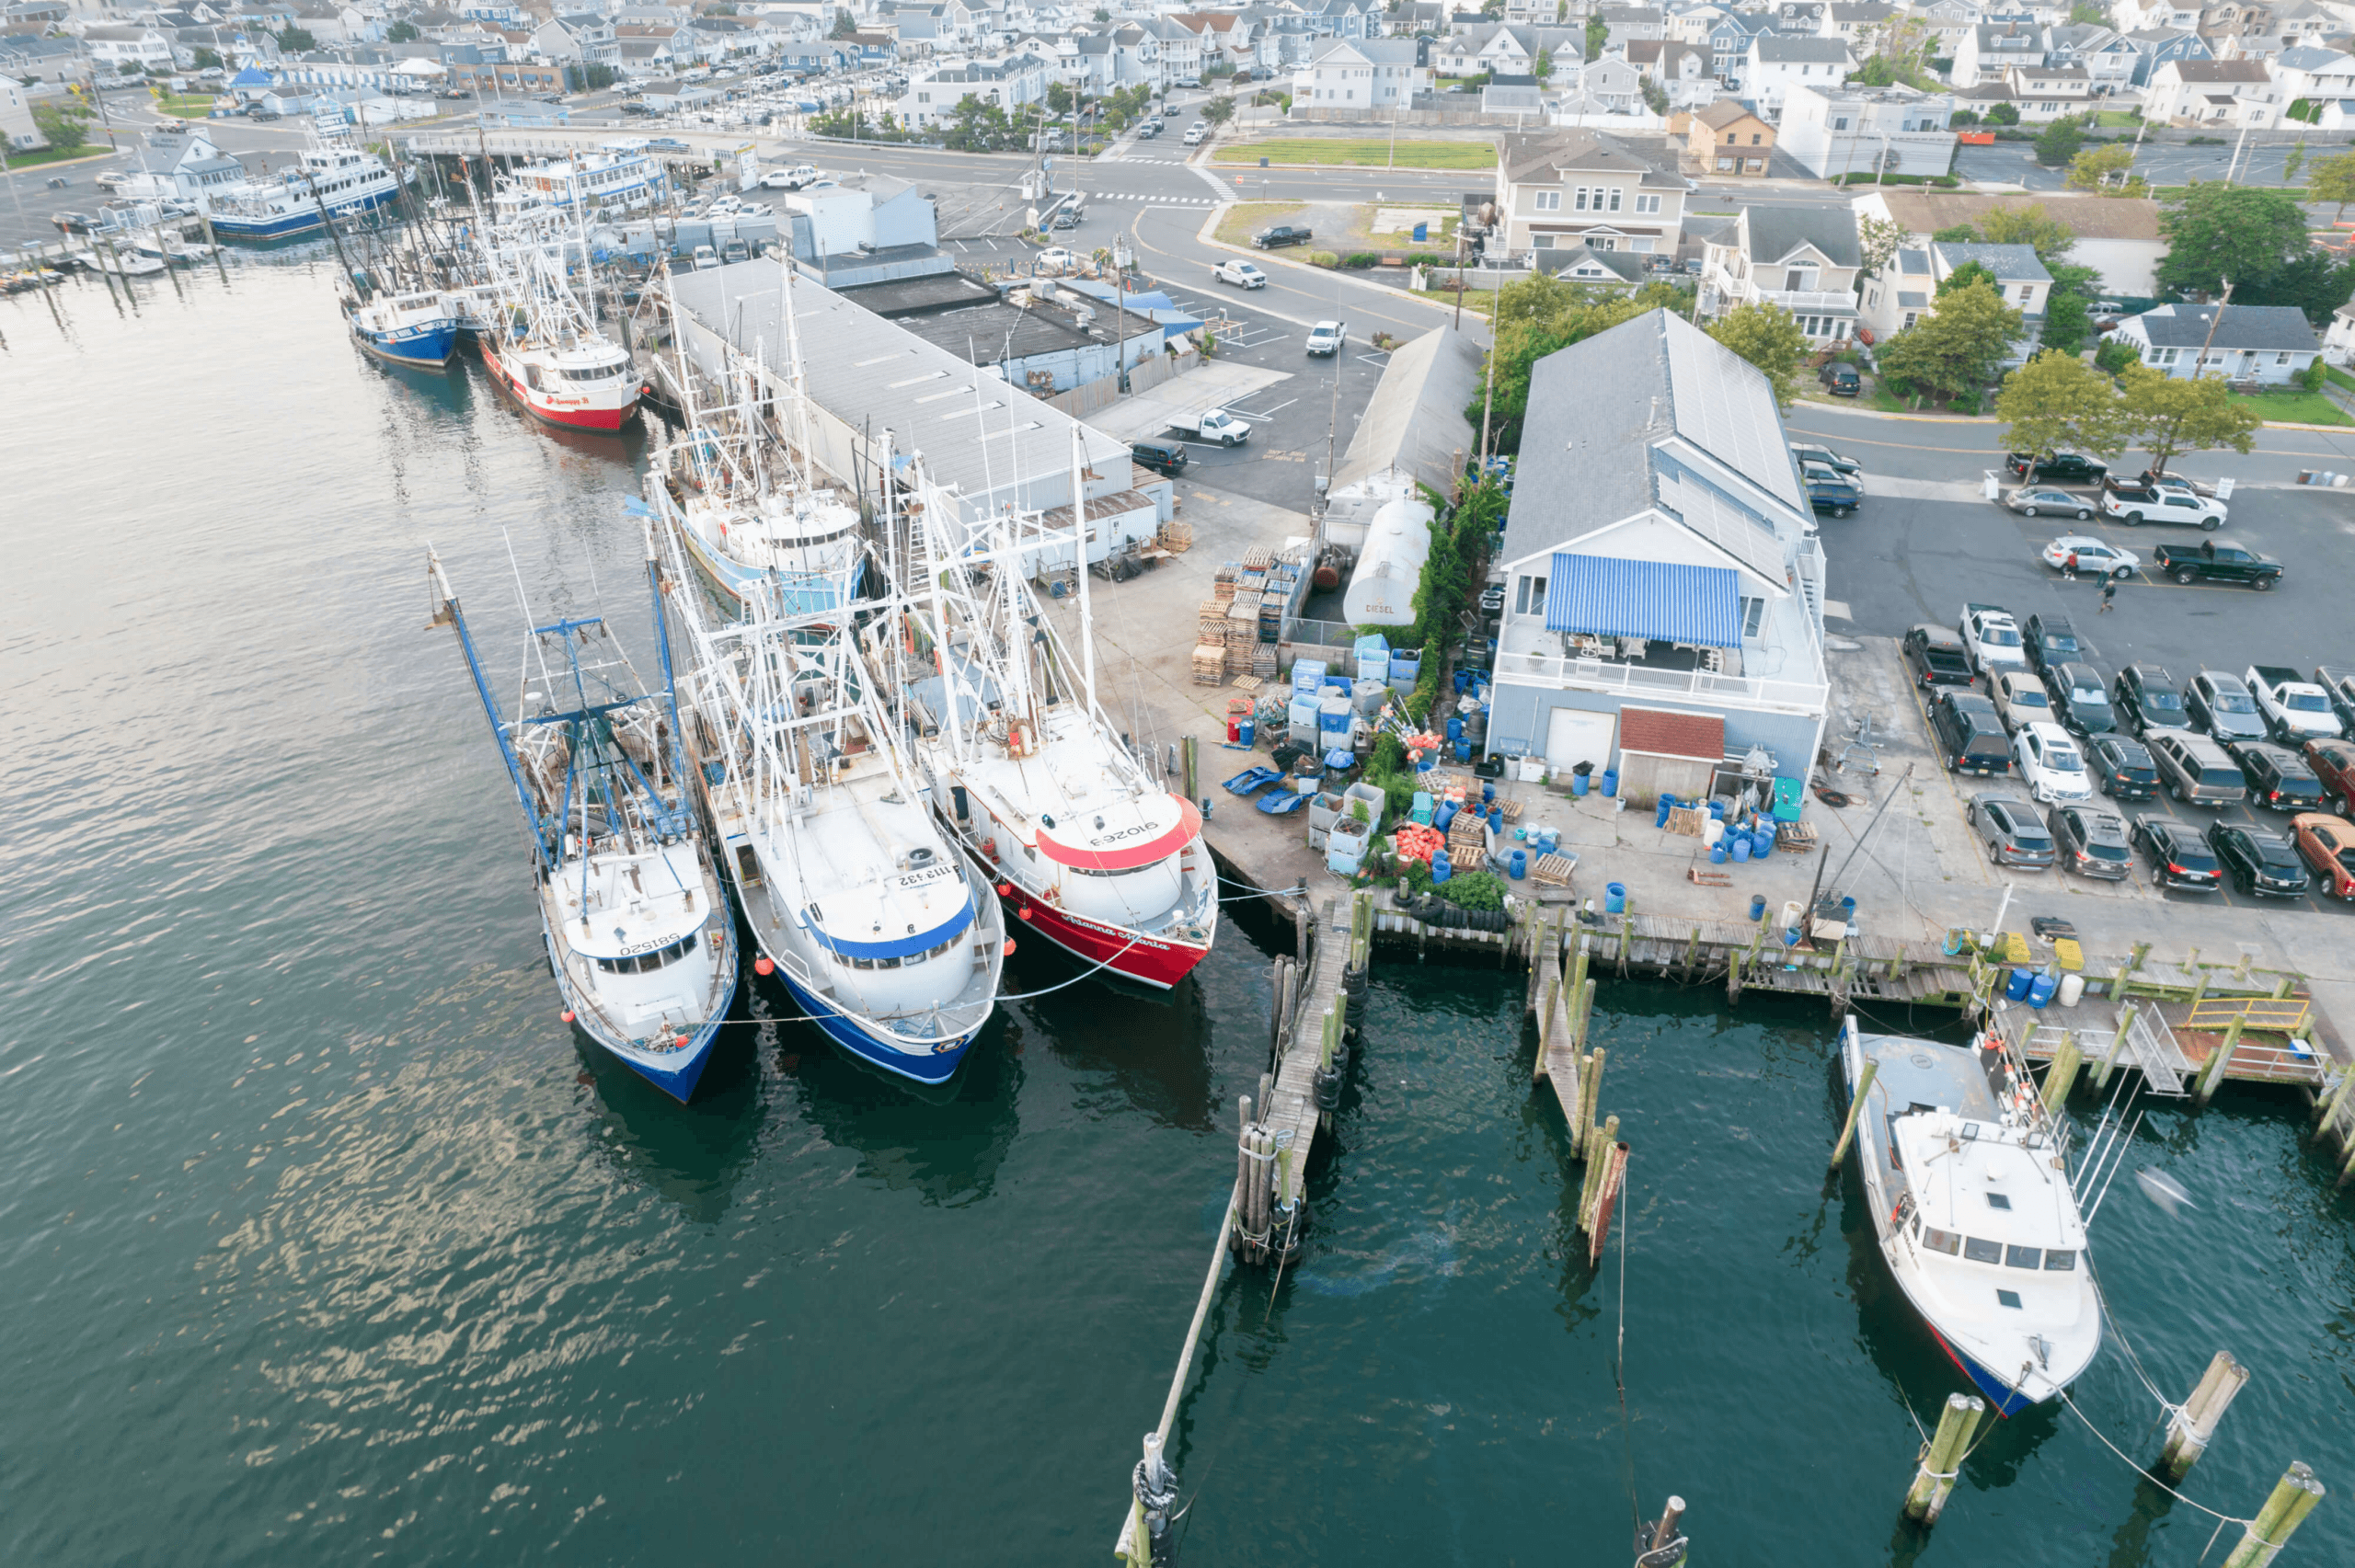
Students compare ocean and coastal acidification using data and infographics. The lesson emphasizes how estuaries and coastal waters experience different conditions than the open ocean.
Section 6 - Biological Impacts of Ocean Acidification
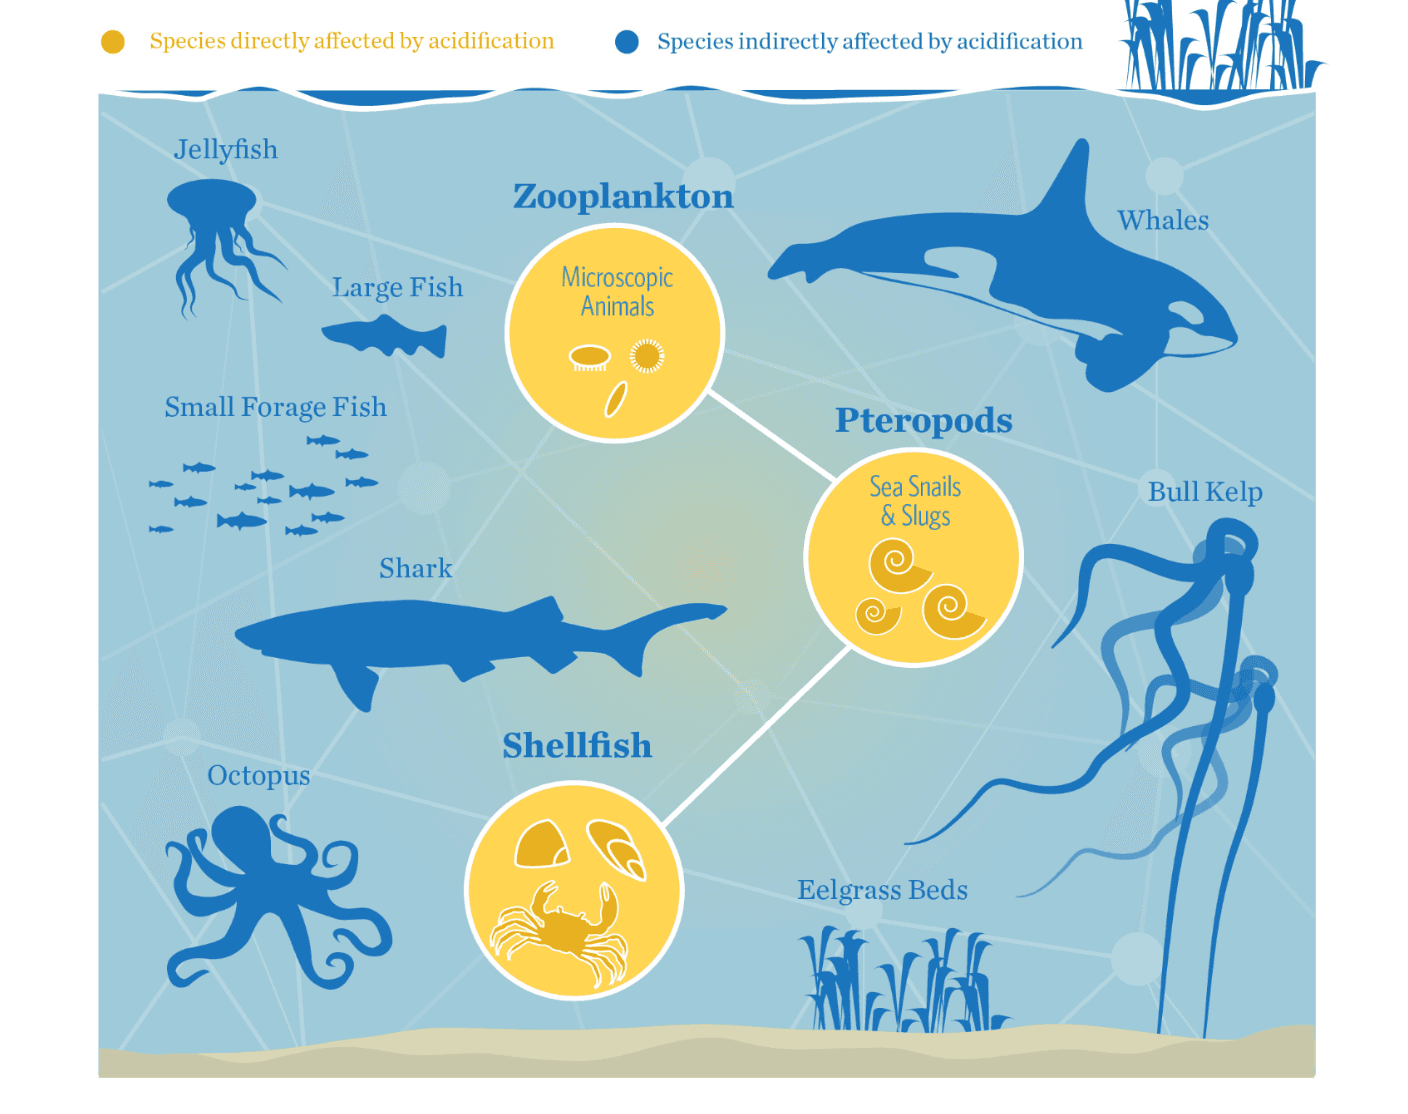
Students examine data on Mid-Atlantic species to understand how decreasing pH affects growth, reproduction, and survival. They connect changes in chemistry to impacts on living organisms.
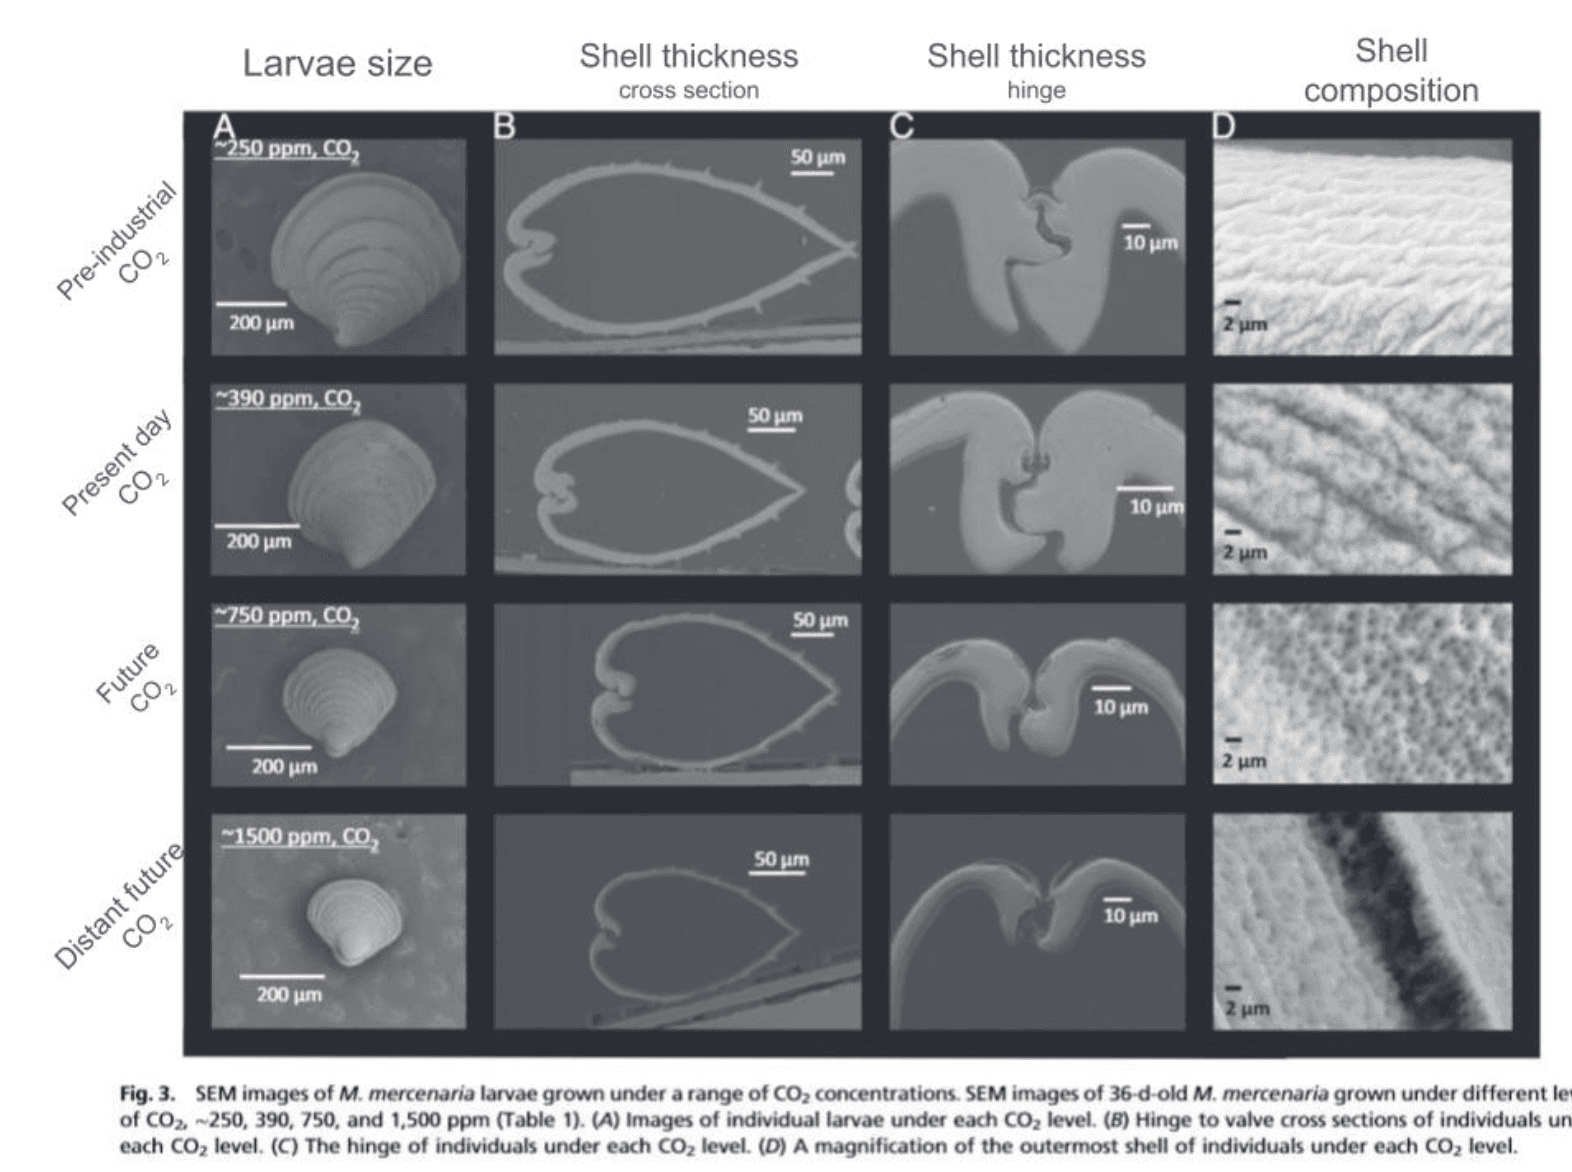
Section 7 - Ocean Acidification and Bivalve Response
Students work individually and in groups to analyze data related to bivalve health. The lesson focuses on interpreting evidence and drawing conclusions about the effects of dissolved CO₂.
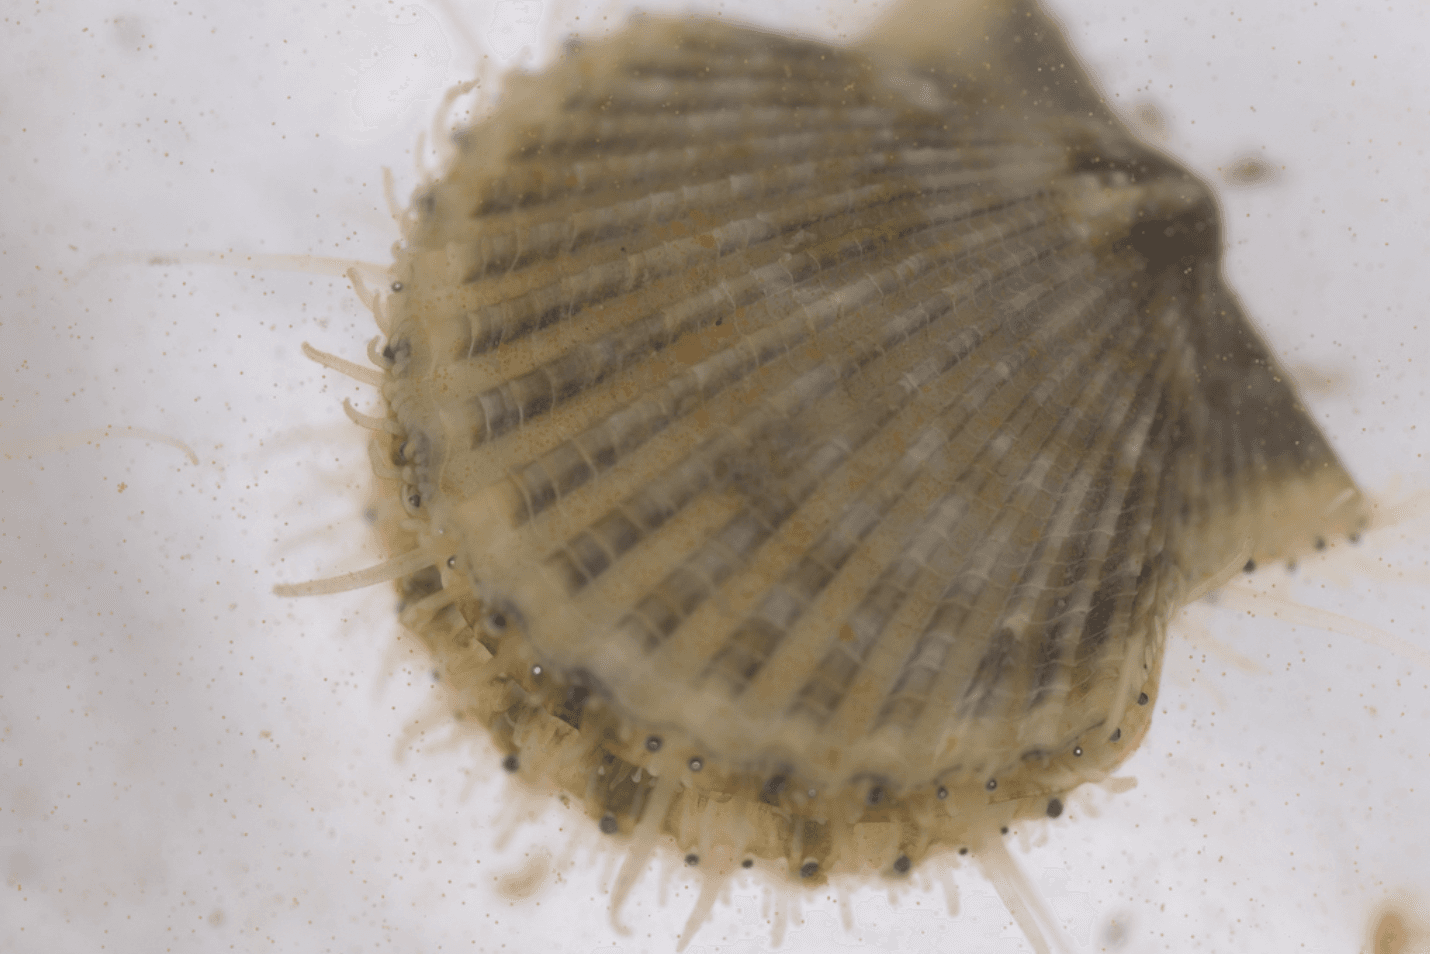
Section 8: Part 1 - The Case of the Vanishing Scallops
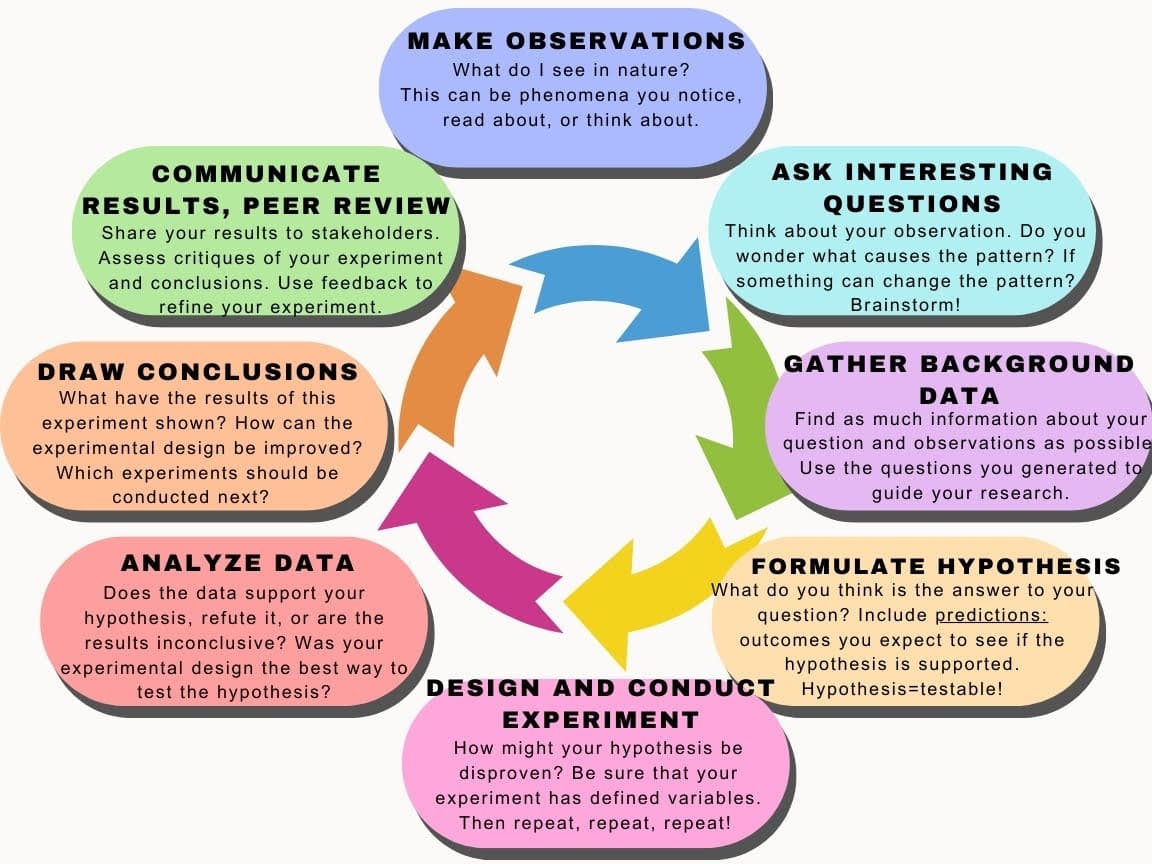
This lesson engages students in investigating declining bay scallop populations while exploring the scientific method and experimental design. Students analyze data, build critical thinking skills, and examine coastal acidification’s impacts on biological species.
Section 8: Part 2 - The Case of the Vanishing Scallops
In Part 2, students apply the scientific method to investigate the bay scallop mystery by reviewing key steps, conducting research, developing hypotheses, and designing experiments to guide their inquiry.
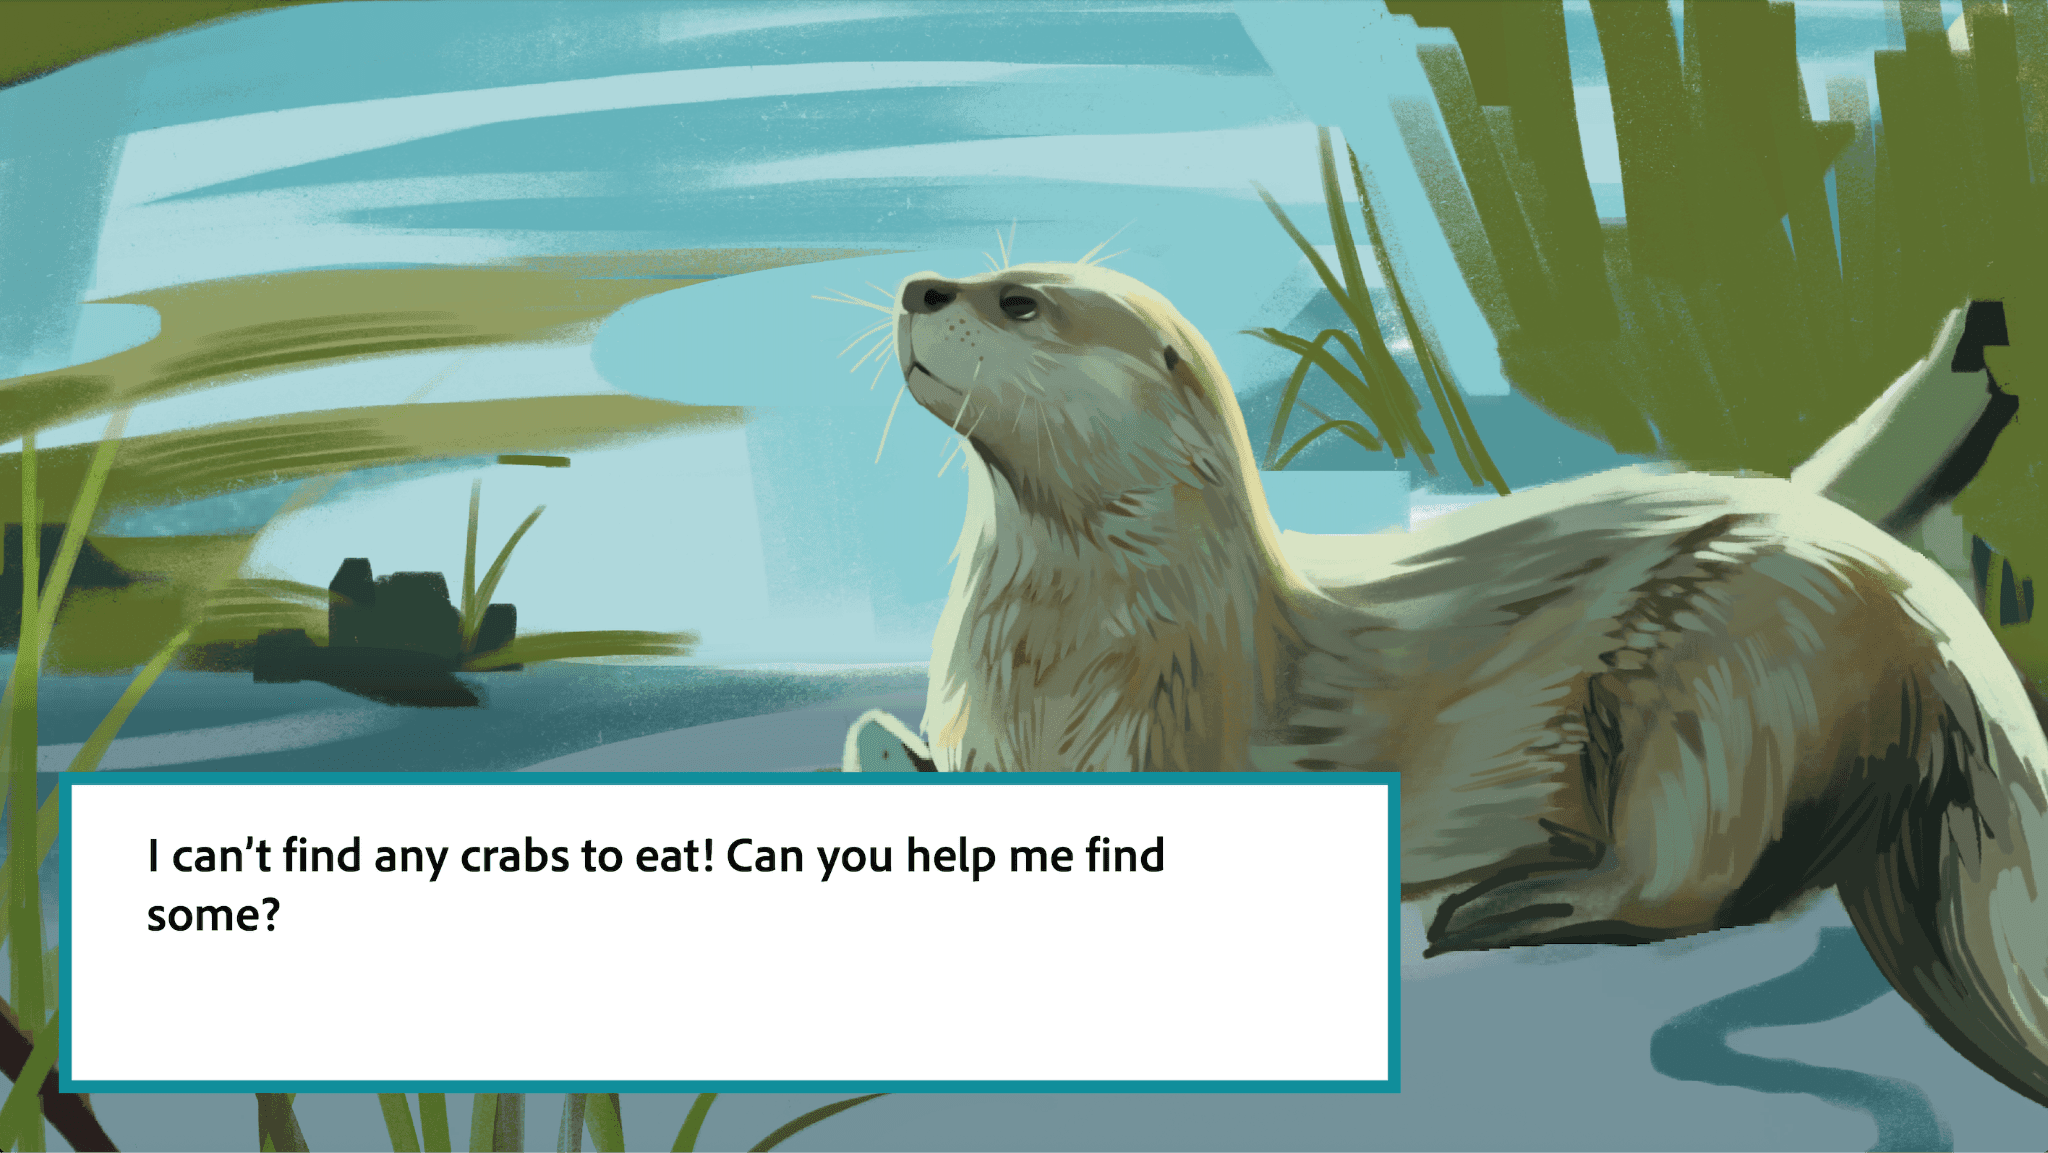
Come along with MACAN and adventure through an education video game that follows acidifcation through coastal habitats. Meet coastal and ocean friends and help them recover from the effects of acidified waters.
Get Involved
If you are interested in learning more about MACAN and the work we do, please sign up for our monthly newsletter. You can also read our 2024 to 2028 Work Plan.

The Mid-Atlantic Coastal Acidification Network. All Rights Reserved.